Gold Holds Above $5194 as Iran-Israel Tensions and U.S. Uncertainty Drive Safe-Haven Demand
Read Time:2 Minute, 50 Second
Finance | Market Analysis
Gold maintains a bullish structure near the $5200 resistance zone as geopolitical tensions and global uncertainty support safe-haven demand.
Gold closed the week at 5194.26 on March 6, 2026, maintaining its broader upward trend despite short-term consolidation during recent trading sessions. The precious metal continues to attract investor demand as geopolitical tensions — including developments involving Iran, Israel and the U.S. — increase global uncertainty and reinforce gold’s traditional role as a safe-haven asset.
Recent geopolitical developments, including tensions linked to the Russia-Ukraine war and rising instability in the Middle East involving Iran and Israel, have renewed interest in gold markets. Political uncertainty in the U.S., including shifts in policy direction and renewed influence from figures such as Donald Trump, has also contributed to volatility in global financial markets.
During periods of geopolitical risk and economic uncertainty, investors often turn to gold as a way to preserve value and hedge against currency and equity market volatility. Investors are also closely monitoring U.S. Federal Reserve policy, inflation data and interest-rate expectations, which continue to influence demand for gold and other safe-haven assets.
Market Structure: Gold Remains in an Uptrend
From a technical perspective, gold continues to show a bullish market structure on higher timeframes. However, during the first week of March the market entered a short consolidation phase.
Price traded within a defined range between:
Support (A): 5052.53
Resistance (B): 5194.26
This range suggests a temporary balance between buyers and sellers as the market prepares for its next potential directional move.
Key Technical Levels to Watch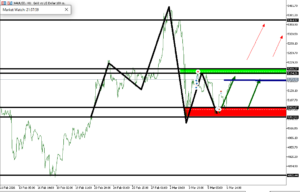
Support Zone
5052.53 (A)
This level acted as strong support during the week. Buyers stepped in around this zone, preventing further downside and keeping the broader bullish structure intact.
If price revisits this level and holds again, it could provide another bullish continuation opportunity.
Resistance Zone
5194.26 – 5208.27 (B–C)
This area represents the immediate resistance zone.
For the bullish trend to continue, price would need to:
• Break above 5208.27
• Retest the level as support
• Continue higher with strong momentum
A successful breakout could confirm renewed buying pressure in the market.
Potential Bullish Target
If gold clears the resistance zone, the next major level to monitor is:
5364.97 (D)
This level could act as the next significant resistance and may represent a potential expansion point for the current bullish trend.
Alternative Scenario: Continued Consolidation
If the market fails to break above 5208.27, gold could continue trading within the established range between 5052 and 5208.
Such consolidation often occurs before a major breakout as institutional traders accumulate positions before pushing the market in a new direction.
Safe-Haven Demand in Uncertain Times
Historically, gold tends to perform strongly during periods of geopolitical conflict, political uncertainty and inflation concerns. With tensions rising across Eastern Europe and the Middle East — particularly involving Iran, Israel and global powers such as the U.S. — investors continue to view gold as a reliable store of value.
Outlook for the Week Ahead
The outlook for the coming week remains cautiously bullish.
Traders and investors will closely watch whether gold can convert the 5200 resistance zone into support.
If that occurs, the path toward 5364.97 could open quickly.
Until then, the 5052–5208 range remains the key technical battleground between buyers and sellers as markets await a decisive breakout.


Happy
0 %

Sad
0 %

Excited
0 %

Sleepy
0 %

Angry
0 %

Surprise
0 %
 0
0
 0
0